From time to time, you might notice that your MySQL database suddenly under-performs. To quickly locate the root cause, one might start digging into MySQL slow query logs, trying to locate the query(ies) taking up the server's resources.
Those slow log files contain lots of metrics for each query execution, which can be overwhelming, especially if you have a busy application with lots of queries constantly being executed.
There are several command line tools out there, doing a fantastic job in analyzing those slow log files and summarizing them (examples: pt-query-digest, mysqldumpslow), so if you never used them, you should definitely check them out.
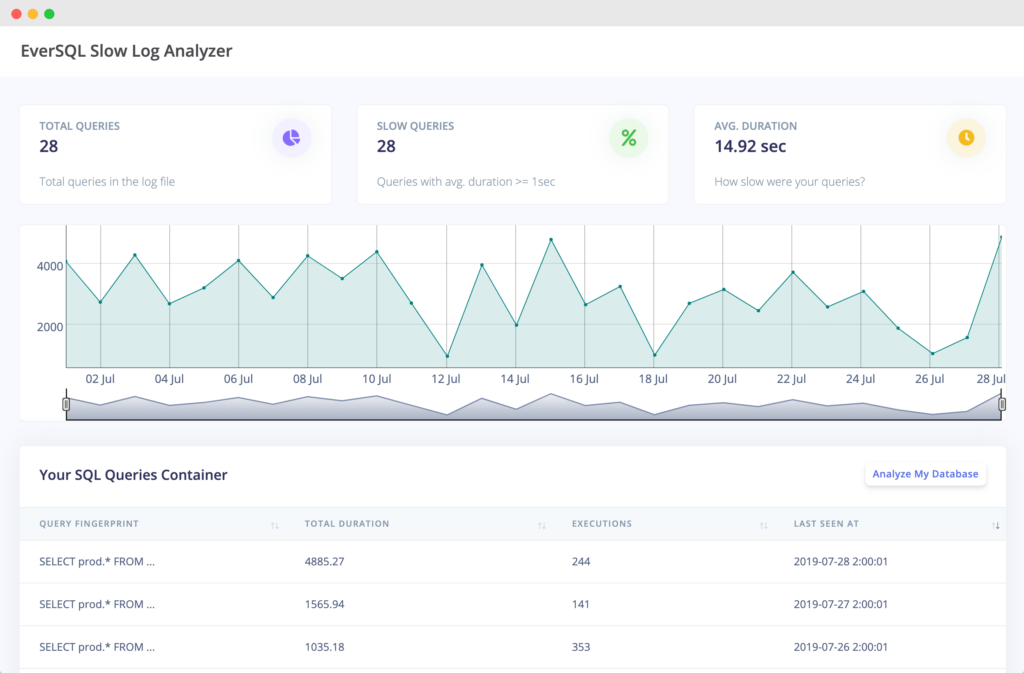
If you're looking for a more visual way to look at those slow logs, another option can be to try out EverSQL's Slow Log Analyzer. This online free tool will analyze, summarize and visualize the slow queries for you.
By default, queries are grouped by their fingerprint, and presented in the query container. Each point in the timeline represents the total duration of queries which ended at that point in time.
The tool is rather lean at the moment, and we're planning to add more options in the near future.
Feel free to send your feedback to [email protected] to help us improve this product.
Summary
If you're looking for a visual way to explore your MySQL slow query logs, take a look at EverSQL's Slow Log Analyzer and feel free to send your feedback to [email protected].


