EverSQL Performance Sensor can automatically track your Google Cloud SQL instances performance, to generate actionable AI-powered optimization insights for you.
To integrate EverSQL Sensor with Cloud SQL, please follow these steps.
Enable the slow query log
If you already have slow query logs enabled for your Cloud SQL instance, you can skip to the next section.
To enable slow query logs:
- Open Cloud SQL Dashboard
- Click Edit on your Database
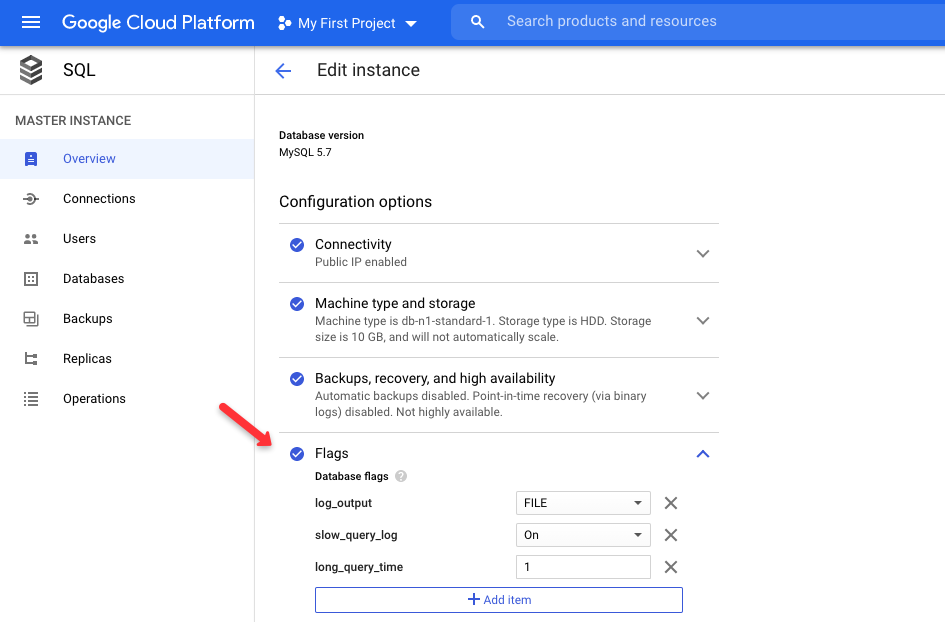
- For MySQL: Add 3 flags (a.k.a. configuration parameters) to your instance:
- log_output - file / table / none
We recommend to choose file, which will help you to quickly visualize and analyze your slow query using EverSQL - slow_query_log - On/Off
- long_query_time - number, in seconds.
For example, 1 means that the log will capture all queries that are longer than 1 second. 0 means capturing all queries.
- log_output - file / table / none
- For PostgreSQL: Add 1 flag (a.k.a. configuration parameters):
log_min_duration_statement - number, in milliseconds.
For example, 1000 means that the log will capture all queries that are longer than 1,000 milliseconds (1 second). 0 means capturing all queries.
Create a pipeline from Cloud SQL to a Cloud Storage Bucket
- In the GCP Log Router console, click Create Sink and choose a name for the Sink.
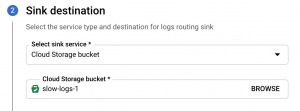
- Choose Cloud Storage Bucket as the destination, click Browse and create a new bucket to hold the logs.

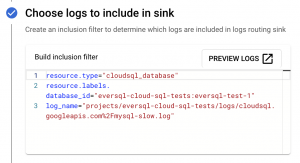
- In the inclusion logs section, please include these filters. Please replace PROJECT_ID and CLOUD_SQL_INSTANCE_NAME with the relevant identifiers from your environment.
For MySQL:resource.type="cloudsql_database"resource.labels.database_id="PROJECT_ID:CLOUD_SQL_INSTANCE_NAME" - Click Create Sink.
Now that we have the slow query logs redirected, you can start the sensor installation, as described in Step #2 in the sensors installation page.

