This post's content
- What is pg_stat_statements ?
- How do I know if pg_stat_statements is enabled?
- I don't see the pg_stat_statements table. How can I enable it?
- How does enabling pg_stat_statements impact performance and does it create an overhead?
- How to disable pg_stat_statements?
- Who can access and see the content of pg_stat_statements?
- How pg_stat_statements is different from slowlogs?
- What columns does pg_stat_statements include?
- How do I select the top queries from pg_stat_statements
- How to find my top PostgreSQL slowest queries?
- Summary - pg_stat_statements
pg_stat_statements is a external library and a name of a table that collects tons of information about your database's executed queries. Like many database performance components, it has pros and cons. here are some frequently asked questions:
What is pg_stat_statements ?
pg_stat_statements is a preload shared library that you can use in order to load additional PostgreSQL functionality. However, today automatic tools like EverSQL will automatically do it for you.
pg_stat_statements tracks execution plans and execution statistics of ALL queries that were executed on the database.
How do I know if pg_stat_statements is enabled?
Try to select from the table
SELECT * FROM pg_stat_statements;
If the table doesn't exist, you will get an error message:
ERROR: relation "pg_stat_statements" does not exist
Note: If you use PostgreSQL performance analyzer tools, you don't need to enable the pg_stat_statements table, and you can still get performance insights about your PostgreSQL.
I don't see the pg_stat_statements table. How can I enable it?
You don't really need pg_stat_statements, as online tools like EverSQL can provide you better outputs.
If you still would like to add it, here are the steps:
- sudo apt install postgresql postgresql-contrib
This will install the add-on package, which is not installed by default. - Open postgres.conf and add the pg_stat_statements to the 'shared_preload_libraries parameter.
- Restart Postgres
- run CREATE EXTENSION pg_stat_statements.
On RDS:
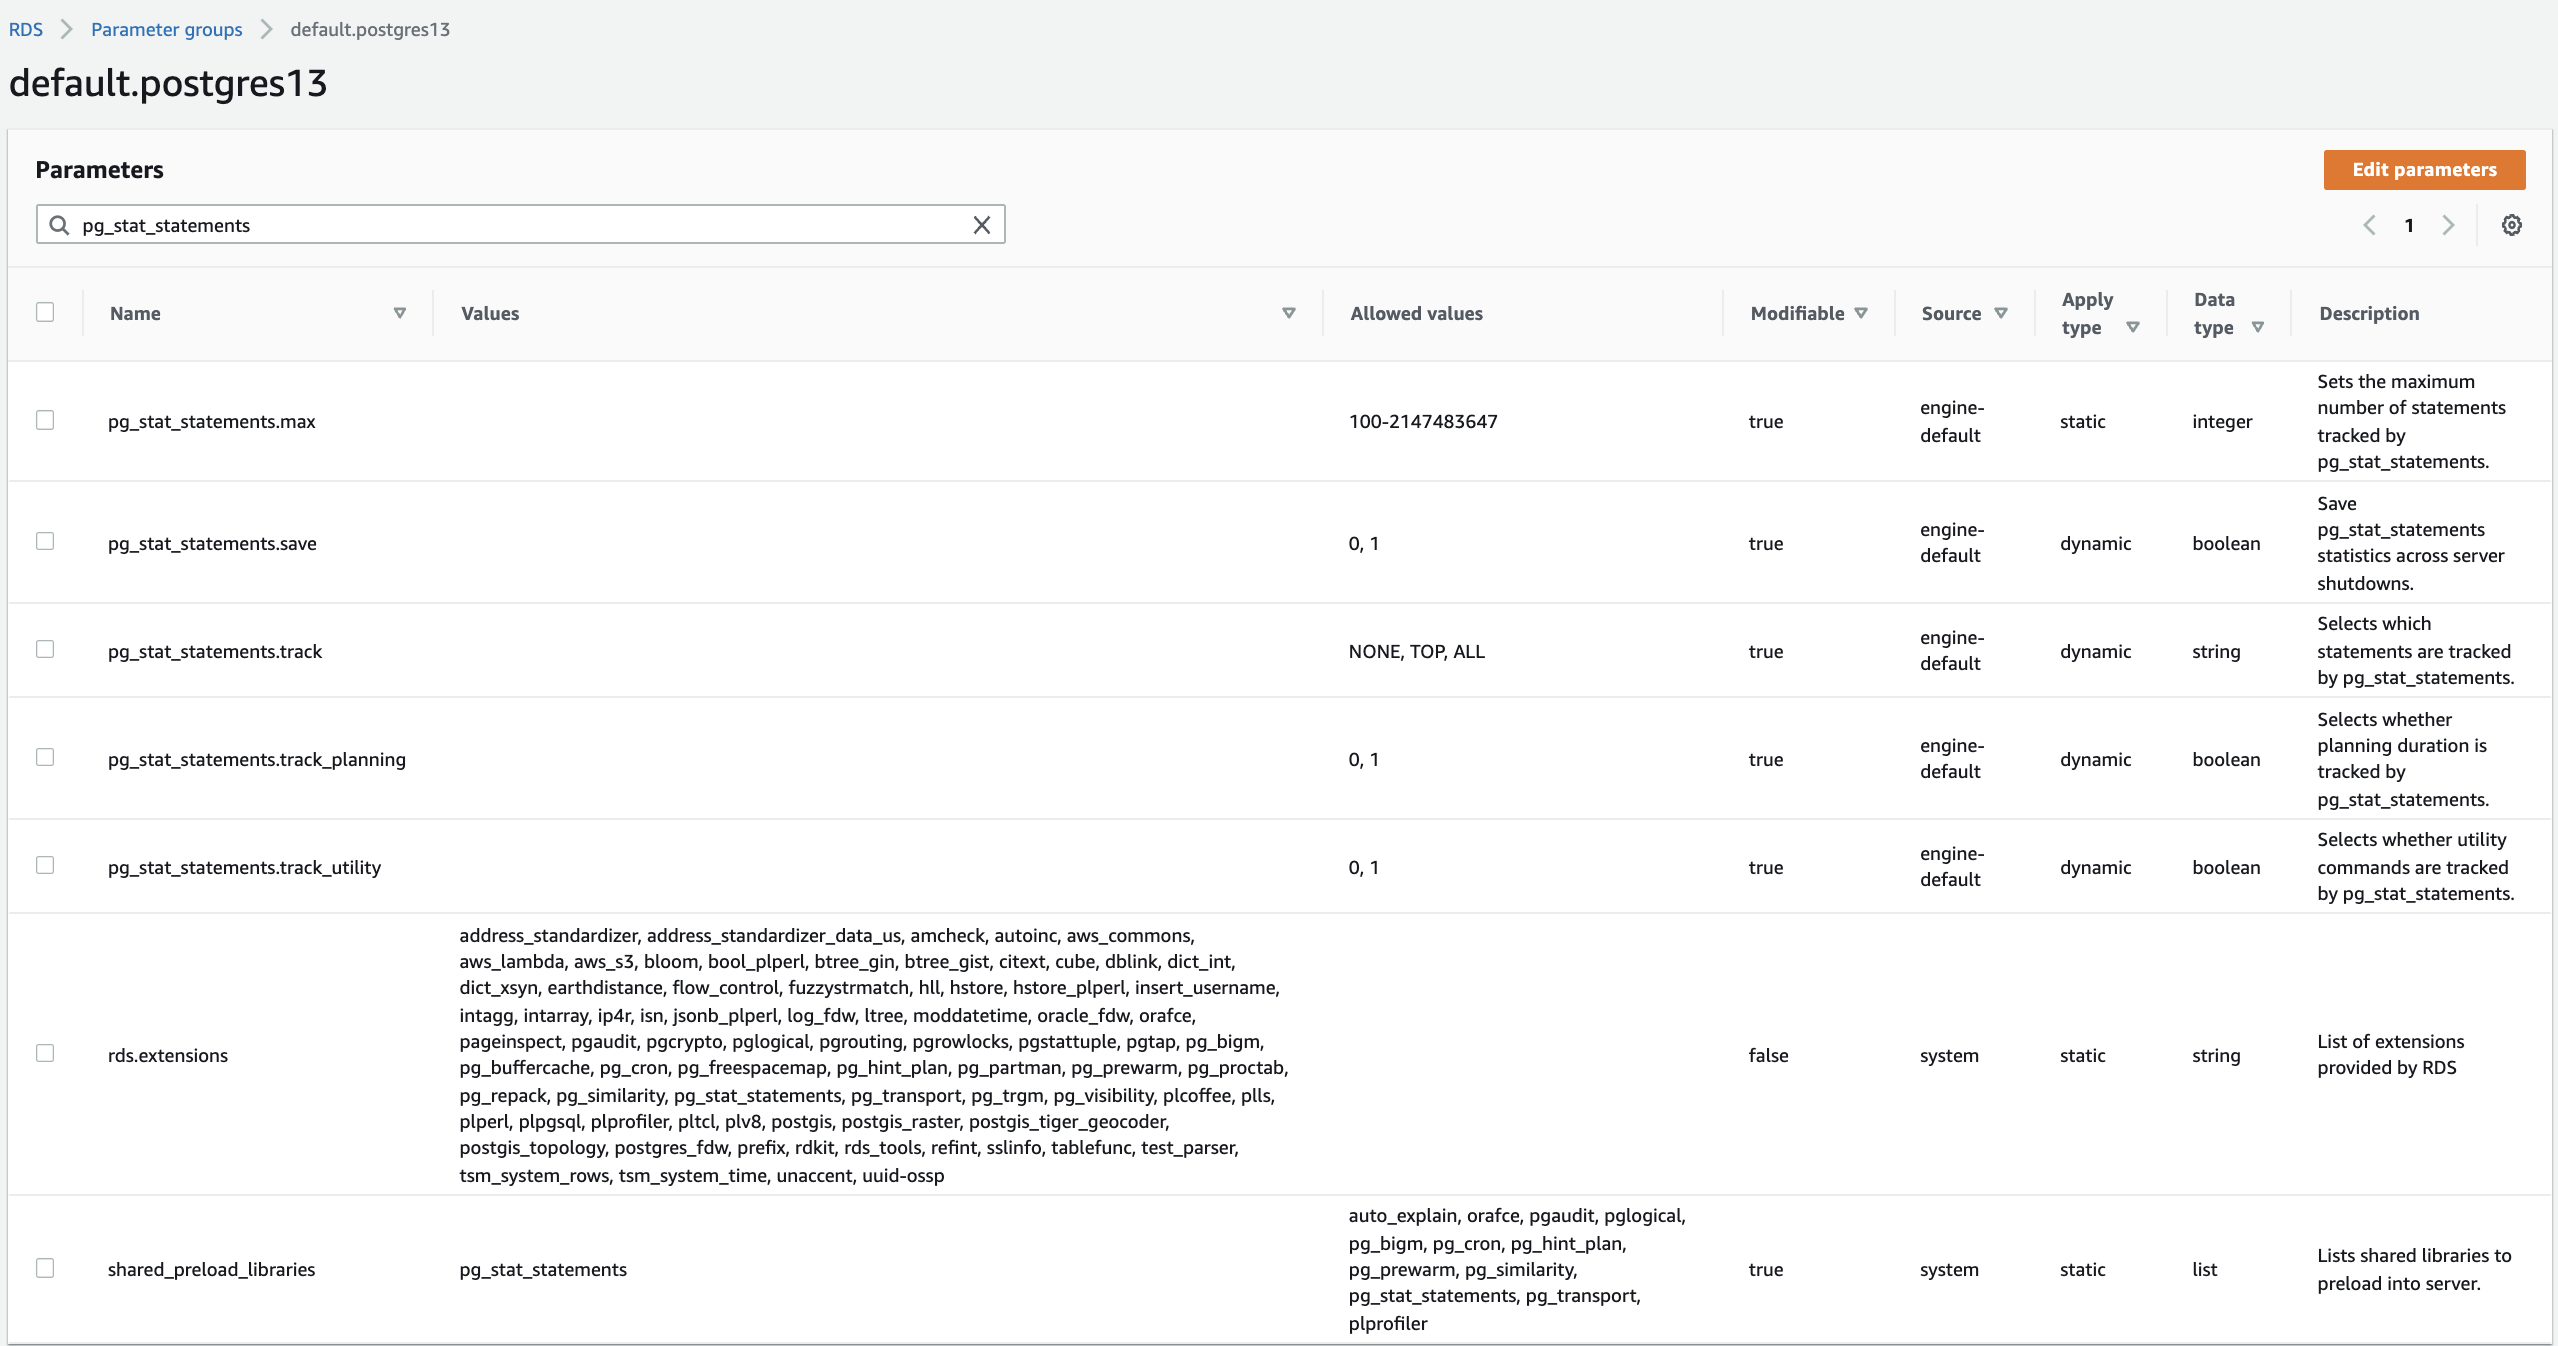
By default, on RDS the contrib package is installed, and the configuration is already set.

So you just need to enable the pg_stat_statements extension, by running:
CREATE EXTENSION IF NOT EXISTS pg_stat_statements;
After that you will be able to see that table.
How does enabling pg_stat_statements impact performance and does it create an overhead?
pg_stat_statements has a performance overhead.
After enabling the pg_stat_statements extension, the database will allocate additional shared memory and pg_stat_statements will consume between 1 to 3% of your CPU time. The percentage depends on your database load and the number of executed transactions. In some PGbench benchmarks it arrived to even 10% impact, or caused other performance issues as mentioned here.
How to disable pg_stat_statements?
DROP EXTENSION IF EXISTS pg_stat_statements;
Who can access and see the content of pg_stat_statements?
The pg_stat_statements contains sensitive information, therefore in order to access it, you should be a superuser or a member of the pg_read_all_stats rold.
other users can see the stats using the pg_stat_statements_info view.
How pg_stat_statements is different from slowlogs?
pg_stat_statements will give you a normalized version of the query, while not showing you the used variable.
for example you ran this query
SELECT firstname, lastname where id = 123456 and firstname = 'John';
On pg_stat_statments you will see
SELECT firstname, lastname where id = $1 and firstname = $2;
Slowlog logs more details and will keep the queries in their original format, so you can see the relevant variables.
In order to enable Slowlogs on your PostgreSQL you should define a threshold, and follow the how to enable PostgreSQL slowlogs guide.
What columns does pg_stat_statements include?
| Column Name | Data Type |
| userid | oid |
| dbid | oid |
| queryid | bigint |
| query | text |
| plans | bigint |
| total_plan_time | double precision |
| min_plan_time | double precision |
| max_plan_time | double precision |
| mean_plan_time | double precision |
| stddev_plan_time | double precision |
| calls | bigint |
| total_exec_time | double precision |
| min_exec_time | double precision |
| max_exec_time | double precision |
| mean_exec_time | double precision |
| stddev_exec_time | double precision |
| rows | bigint |
| shared_blks_hit | bigint |
| shared_blks_read | bigint |
| shared_blks_dirtied | bigint |
| shared_blks_written | bigint |
| local_blks_hit | bigint |
| local_blks_read | bigint |
| local_blks_dirtied | bigint |
| local_blks_written | bigint |
| temp_blks_read | bigint |
| temp_blks_written | bigint |
| blk_read_time | double precision |
| blk_write_time | double precision |
| wal_records | bigint |
| wal_fpi | bigint |
| wal_bytes | numeric |
How do I select the top queries from pg_stat_statements
You can do that, but you don't need. PostgreSQL monitoring tools can do it for you, automatically, and for free.
If you still want to run it from your IDE, you can use the query below and receive some of the stats.
select
  substring(query, 1, 50) as short_query,
  round (total_exec_time :: numeric, 2) as total_time,
  calls,
  round(mean_exec_time :: numeric, 2) as mean,
  round (
    (
      100 * total_exec_time / sum (total_exec_time :: numeric) over ()
    ) :: numeric,
    2
  ) as percentage_overall
from
  pg_stat_statements
order by
  total_time desc
limit
  20;
How to find my top PostgreSQL slowest queries?
You can do that, but you don't really need. There are tools like EverSQL that do it for you, automatically, and for free.
If you still want to run it from your IDE, you can use the query below that will give you some of the stats.
SELECT total_exec_time, query
FROM pg_stat_statements
ORDER BY total_exec_time
DESC LIMIT 10;
Summary - pg_stat_statements
Pg_stat_statements is a great external mechanism that can help professionals to understand which queries run on their database. However, for most developers, automatic tools for Analyzing PostgreSQL Performance, can save time and provide immediate actionable insights.
Click here to try it, for free.


