This post's content
#1 - EverSQL
EverSQL provides SQL query optimization and database observability, powered by AI.
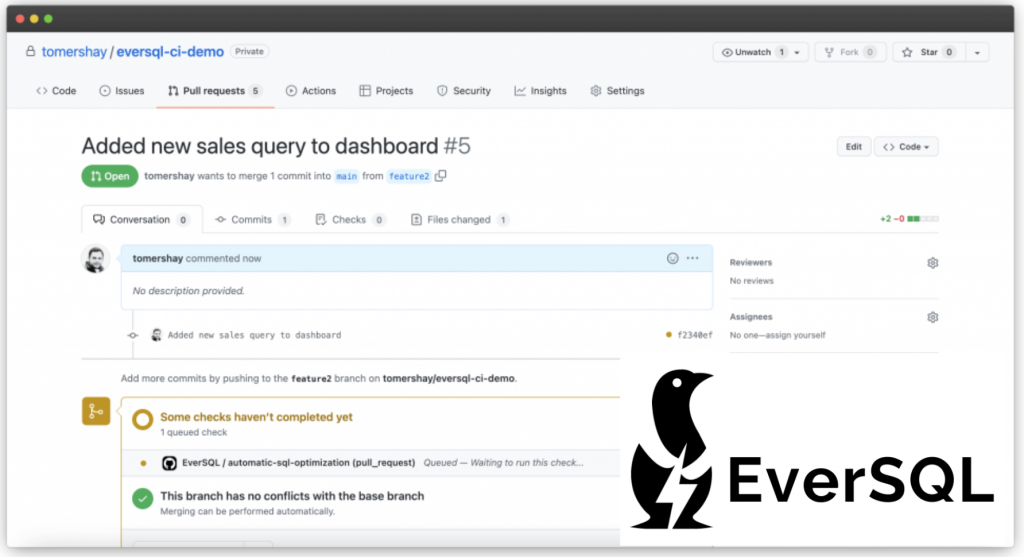
EversSQL's optimization capabilities can be integrated into your CI workflow, to automatically and contentiously optimize your SQL queries. The integration can be implemented by creating a GitHub action, Jenkins, or any tool that utilizes EverSQL's Optimization API capabilities, to automatically optimize queries from *.sql files and report back the results as a pull request check results.
You can use this guide if you׳re looking to implement an automatic SQL profiler (or an SQL performance linter), integrated with GitHub.
Pros:
- Automatically rewrites SQL queries and optimize them.
- No DBA skills required.
- Simple API to solve performance bottleneck.
- Recommends missing indexes automatically.
- Provides insights such as workload analysis and new query load discovery.
- Educate users on best practices with real examples
- Find redundant indexes
- Analyze slow query logs and optimize queries in bulks
- Aggregate query executions by fingerprints for easier prioritization
- Support for both cloud-based and on-premise platforms
- Supports PostgreSQL on AWS EC2, AWS Aurora, Google Cloud SQL, Google Compute, Azure VB, Azure DB, Centos, Debian, Windows, Ubuntu and RedHat, Fedora and more.
Price: Free SQL optimization as a part of the free tier. 14-days free trial for advanced features. Starts at $79
#2 - LiquiBase
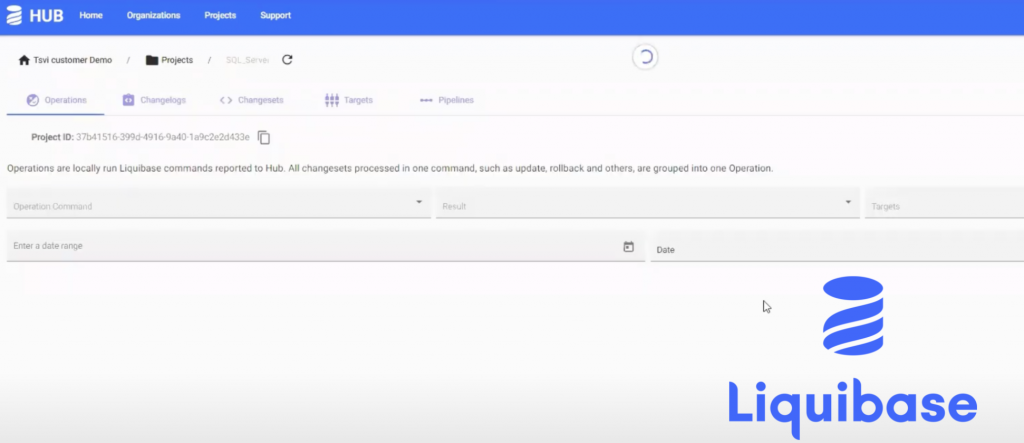
Liquibase Community is an open-source project that helps millions of developers rapidly manage database schema changes. With Liquibsae you can track, version, and deploy database changes.
Liquibase also has a paid version that includes advanced features.
Pros:
- Flexible database change - Easily define changes in SQL, XML, JSON, or YAML.
- Version control for your database.
- Control when, where, and how database changes are deployed.
- Auto-generate scripts - Automatically generate SQL scripts for reviews.
- Repeatable migrations- Perform rerunnable vs. non-rerunnable changes.
- Integrations and extensions - Works with the tools and database platforms you use.
- Rollbacks - Undo database changes, either automatically or via custom rollback SQL.
- Context-dependent logic - Use contexts and preconditions to fine-tune script execution.
- Easy way to export your schema and perform Automatic Database Tuning with EverSQL.
Price: Basic open source capabilities for free. The paid edition starts at $165 (for 5 targets)
#3 - JFrog
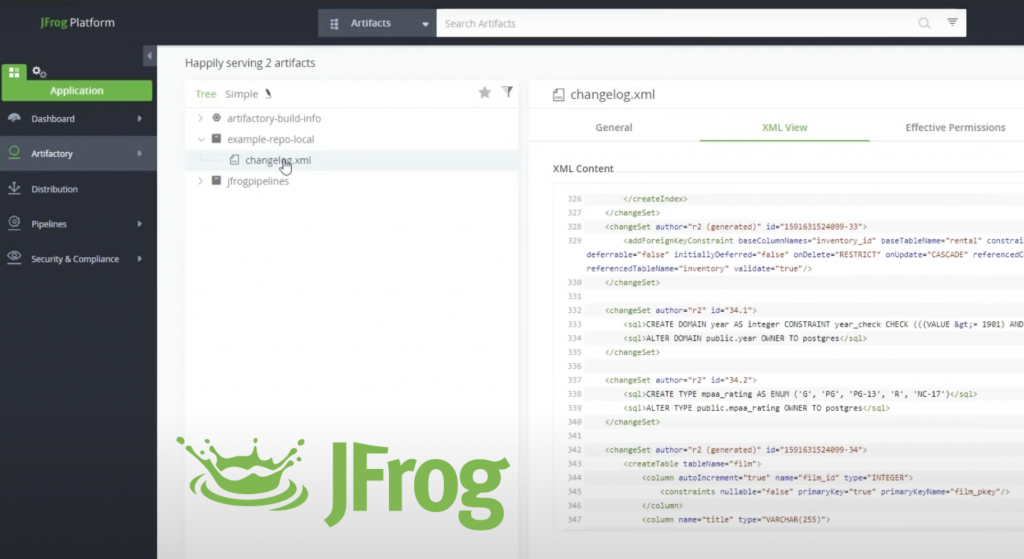
JFrog Pipelines helps to ship updates faster by automating DevOps processes in a continuously streamlined and secure way across all their teams and tools. Encompassing continuous integration (CI), continuous delivery (CD), infrastructure and more, it automates everything from code to production. Pipelines is natively integrated with the JFrog Platform and is available with both cloud (software-as-a-service) and on-prem subscriptions.
Pros:
- Scales horizontally - allowing you to have a centrally managed solution that supports thousands of users and pipelines in a high-availability (HA) environment.
- Pre-packaged declarative steps with no scripting required, making it easy to create complex pipelines, including cross-team “pipelines of pipelines.”
- Integrates with most DevOps tools. The steps in a single pipeline can run on multi-OS, multi-architecture nodes, reducing the need to have multiple CI/CD tools.
- Real-time interactive dashboard with alerts and notifications to easily identify and escalate bottlenecks and failures.
Pipelines-as-Code. - Easy-to-learn YAML syntax that is standardized across the pipeline steps. The configurations are versioned, modular, reusable, and modern.
Price: Free tier available. Team edition starts at $98
#4 - ELK stack
"ELK" is the acronym for three great open source projects: E of Elasticsearch, L for Logstash, and K for Kibana.
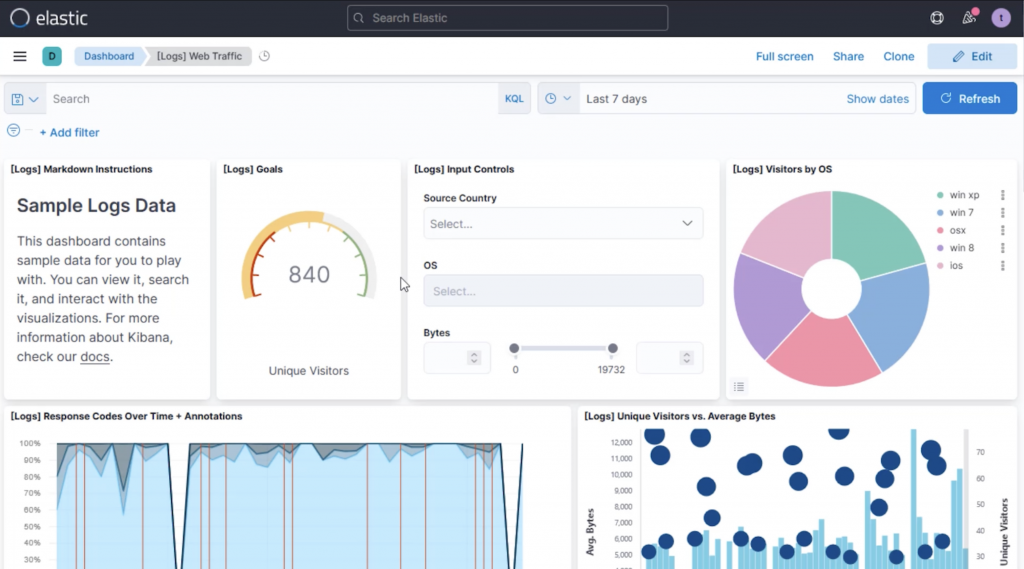
Elasticsearch is a search and analytics engine. Logstash is a server-side data processing pipeline that ingests data from multiple sources simultaneously, transforms it, and then sends it to a "stash" like Elasticsearch. Kibana lets users visualize data with charts and graphs in Elasticsearch.
Pros:
- Multiple hosting options - Can be hosted by Elastic, other cloud vendors, or on-prem.
- Battle tested products to support massive scale.
- API and interfaces to support multiple programing languages: JavaScript, Go, Python, .NET, and Perl.
- a powerful platform that collects and processes data from multiple data sources, stores that data in one centralized data store that can scale as data grows.
- Real-Time Data Analysis & Visualization.
- An open source project.
- Helps to monitor and troubleshoot your database.
Price: Open source options. Paid edition starts at around $100 , but can grow rapidly if not well designed.
#5 - Datadog
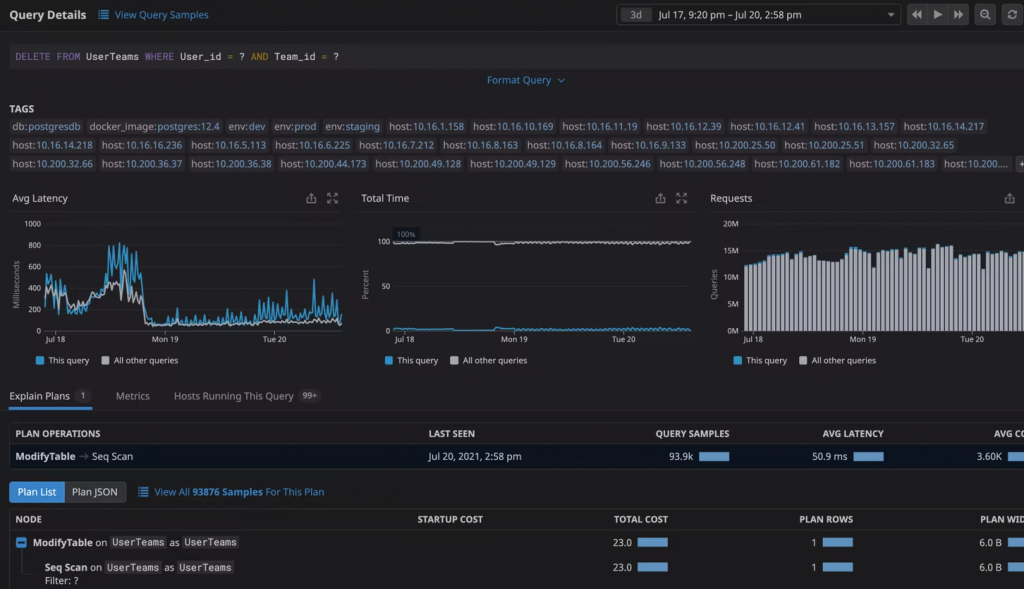
Datadog Database Monitoring allows you to view explain plans from all of your databases in a single place. With Database Monitoring, any database expert can quickly pinpoint costly and slow queries and drill into precise execution details to address bottlenecks. Additionally, query and host metric correlation makes it easy to identify and understand the impact of resource constraints on database performance.
Pros:
- Out-of-the-box integration with the rest of the Datadog platform, including dashboards, monitors, SLO tracking, and advanced formulas and functions.
- Display differences between multiple explain plans.
- Monitors connections, queries, raw access.
- Monitor Host and instance.
- Track Backup and Replication status.
- Disk monitoring for capacity planning.
- Role-based access control.
- SLA monitoring.
- Auto-discovers replication topology.
- Full NDB cluster support (Auto-Discovery, Visualization, and grouping of NDB processes).
Price: Per Server. You need to be an existing DataDog Infrastructure Monitoring customer to purchase Database Monitoring.
#6 - DBmaestro
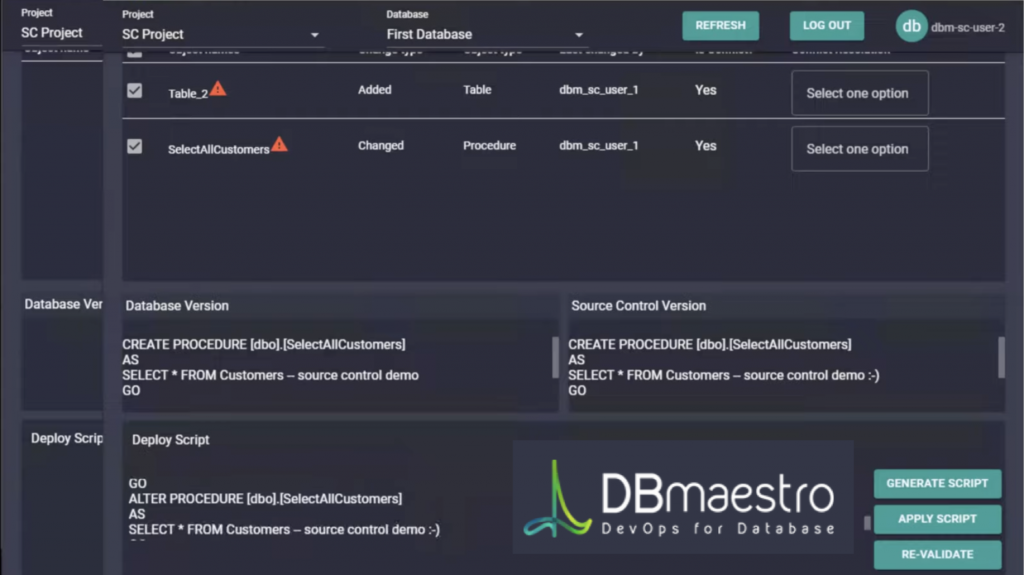
DBmaestro helps you to automate, secure and govern your Database CI/CD pipelines with a Database DevOps platform.
You can release faster while improving quality with smart automation for your database. Accelerate feedback loops between teams.
Pros:
- Static code analysis.
- Prevent and manage configuration drifts.
- DryRun DB code - developer CI feedback loop.
- Database release automation pipelines.
- CI/CD integration and plugins (Jenkins, ADO, CircleCI etc.).
- Ticketing system integrations (ADO, Jira, ServiceNow etc.).
- Smart backups.
- Organizational Policy management.
- AD & LDAP group integration.
- Compliance reports.
- Automated documentation of database changes.
- Team collaboration and sandbox synchronization.
- Branching and merging of database projects.
- Easy way to export your schema and perform Automatic Database Tuning.
- Automated generation of database change scripts.
- Dashboards - DevOps metrics and reports.
Price: Starts at $69 per environment.
#7 - Grafana
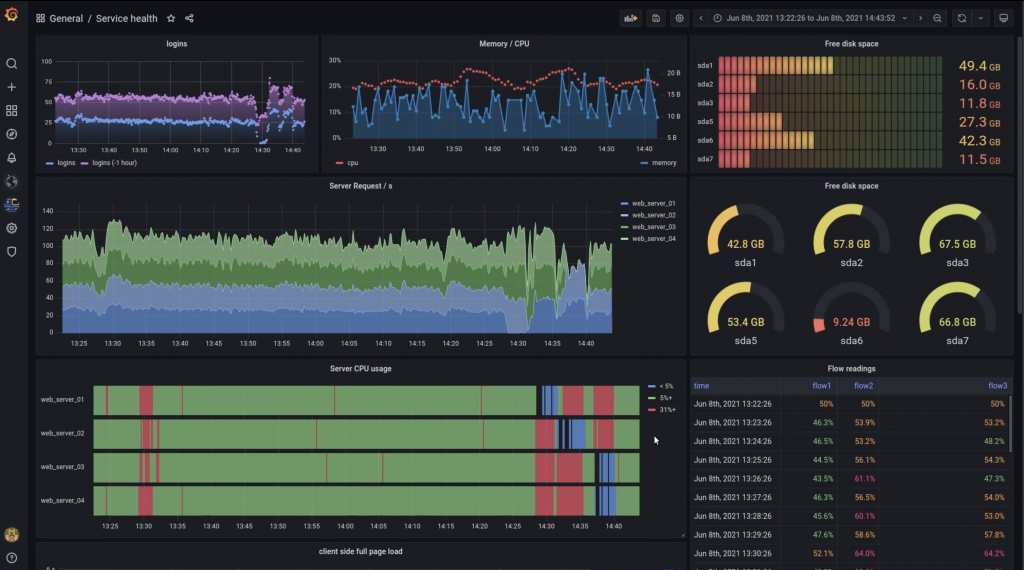
Grafana Cloud is a composable observability platform, integrating metrics, traces and logs with Grafana. Leverage the best open source observability software – including Prometheus, Loki, and Tempo – without the overhead of installing, maintaining, and scaling your observability stack.
Pros:
- Compose and scale observability.
- Bring your own data - Send your local Prometheus and Loki data to Grafana's backend.
- Good visualization - Grafana is at the center of every Grafana Cloud stack. Grafana allows you to query, visualize, alert on, and understand your metrics no matter where they are stored.
- Correlate metrics and logs side-by-side.
- Easy troubleshooting - Find logs for a specific span in your traces.
- Simple alert configuration in Grafana Cloud.
- OnCall module - Grafana OnCall is an easy-to-use on-call management tool built to help DevOps and site reliability engineering (SRE) teams improve their collaboration and ultimately resolve incidents faster — right within Grafana Cloud.
- Extended billing visibility -Access a detailed breakdown of your monthly usage and estimated bill whenever you need it, and set up billing alerts so you’re notified if usage changes.
Price: Open Source options with a basic free tier. Starts at around $49/mo + usage.
